Thursday, August 12, 2010

As promised, here are some more detailed images of my space-time map diagrams. They are of course hyper-simplified space-time diagrams, if this were not the case they would lose all symbolic meaning and be completely unreadable(with the Earth moving through space over time and everything). The primary purpose of these maps was to track the rise of sea levels in afew significant locations over the next 500 years. The grey lines indicate current sea levels, the red lines indicate sea levels between now and the mid 23rd century. The purple lines indicate sea levels from the mid 23rd to middle 24rth century and the blue lines indicate sea levels from 24th century onward. In the rendering these diagrams I found these colors mixing unexpected ways. This may be the result of some seismic activity which I haven't detected in my research, however this is most likely the result of tides advancing and retreating and the redistribution of sand bars through the process of erosion over the next 500 years.
It is difficult to track this trend further into the future as these diagrams show a sea level of 14 meters above the current level, which would mean that the worlds' oceans would be so dilute with fresh water that ocean currents would totally cease, resulting in an ice-age. This ice-age would cause sea levels to drop drastically, but the areas depicted in these maps would then be covered in icecap.
It is a question which demands more research.

Here we see the Bai des Chaleur, in northern New Brunswick. Specifically: Bathurst NB, I find myself nonplussed in the knowledge that my parents' home will be completely submerged within 500 years.

Below we see the bay of Fundy/Tantramar Marsh area, the lower right hand portion of the image being the lowland marsh with the dense sea level activity, bad news for Sackville and Amherst . The left area of the map being the Fundy region which has the highest tides in the world; alot of cliffs, so not alot of action there.

Note the sea level/fauna/time correlation in the color coding.
Below we have a portion of the Petitcodiac River. Interestingly, this part of the river which goes through Mocton and Riverview got turned into a muddy tidal shit hole when a causeway went in in the 1990s. This map shows that within the next 200 years the causeway will be overwhelmed and the river will be back to it regular flow, its just a bit constipated now.

Note the junction points for the SV-2 transportation system.

While my research far too complicated for laymen to reproduce, I have found a fun map site for looking at sea level change.

Saturday, May 29, 2010

January 2010: presentation of evidence

Its been a long time since my last post. I have recently been completely occupied by my investigation into the mechanics of what makes my futurology work possible. The most interesting lead I've come across is the "Feynman Radio" theory, which is based on the work of physicist Richard Feynman. According to this theory it is hypothetically possible for people in the future to send messages from the future into the past using advanced electromagnetic waves or advanced neutrinos which travel backward in time as opposed to the ordinary retarded electromagnetic waves or retarded neutrinos which travel forward in time. But, why it is that I seem to be a receiver for these advanced electromagnetic waves? I will post as soon as I find an answer to this question.

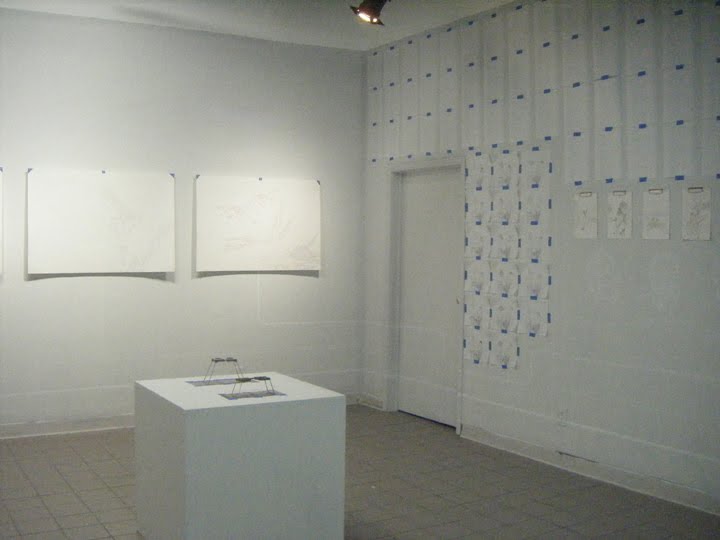
Until then, I will post these images of my research which was presented at Galerie Verticale in Jan/Feb of 2010.
No, this gallery is not an appropriate venue for the dissemination of my research, but until such time that the proper scientific institutions come around to recognizing the legitimacy of my work I will have to subvert said institutions by displaying my research in artist run centers and the internet: the two great refuges of the uncanny and the misunderstood.


These three large maps(shown above) are in fact space-time diagrams depicting various regions of New Brunswick. I will be posting more detailed images of these shortly.
Shown above is my first foray into stereo drawtogarphy, a superb method for futurological investigation.


Tuesday, December 15, 2009

Monday, December 14, 2009

FUTURE ARCHEOLOGY

Here I have compiled some of my research along with audio in response to my detractors.

Tuesday, November 10, 2009

Neo-fauna


figure 1

This animal(fig 1) will disappear in the early 23rd century due to lack of habitat caused by poorly planted monoculture forests.


figure 2

This animal(fig. 2) will emerge in the late 23rd century in an unprecedented speciation event. Their small size will allow them to move freely in the cramped forest, enabling them to reach food sources. An almost total lack of predation(fig. 3) will allow them to reach huge numbers. They will be considered pests due to there interference with human activity(see img. 1 below).


figure 3


figure 4

This animal(fig. 4) is an engineered species which will be introduced in the mid 24th century with the intent of lowering the population of the animal pictured in figure 2(see img. 2 below). Over time they will be so effective at this that they will eliminate their primary food source and move on to other prey(see img. 3 below).

figure 5

This engineered species(fig. 5) will be introduced in the early 25th century to eliminate the population of the animal pictured in figure 4. They will prove to be very effective at this(see img. 4 below) and will prove to be docile, good natured animals in their interactions with humans.


figure 6

Unfortunately, the extreme engineered elements of the gene structure in the animal pictured in figure 5 will become recessive over generations of breeding in the wild. Causing them to be predisposed to chronic back and joint pain(fig. 6).


image 1


image 2


image 3


image 4

Saturday, October 10, 2009

Interference


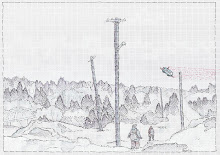
recent research into the movement of the NB-Jumper have led me to what I believe is a hub of jumper activity(rendered above).

Tuesday, September 15, 2009

subspeciation


Recent research into distant effects of genetic manipulation seem to indicate a much greater amount of diversity and subspeciation than initially anticipated.